Alaska Whale Foundation Research Report: August, 2023
- AWF Team

- Sep 27, 2023
- 3 min read
Updated: Oct 20, 2023

Month at a Glance:
Effort:
Days on the water: 12
Sampling stations: 103
Total # ID: 432
Drone flights: 57
Biopsies: 5
Nutrient samples: 115
CTD casts: 103
Whale Poop: 8
Whale Numbers:
Number of unique whales: 355 (Total for year: 527)
Number of cow-calf pairs: 14 (Total for year: 23)
Bubble-netting groups: 3
Number of unique bubble-netters: 28 (Total for year: 111)

Above: Distribution of humpback whales photo-identified during August 2023. Size of red circles reflects group size (smallest circle = 1, largest = >16 whales). Triangles represent locations of surveyed “Point Count” stations for estimating whale abundance; these provide an indication of where photo-identification efforts were conducted (and, due to weather, were not).
Research Overview:
August was a busy month for field work. Weather was largely amenable to surveys so, once again, we were able to visit nearly all (95%) of our 108 survey stations.
Whales were considerably more abundant than in previous months. Overall, we observed nearly twice as many unique individuals, the majority of which (~79%) were new for the year suggesting that, while numbers increased, many animals identified in earlier months had subsequently moved to areas outside of our study region. Although whales were generally observed throughout the survey region, they were most abundant in central Chatham Strait and Frederick Sound.
Of the whales we observed, 230 (65%) have been linked to breeding grounds. Of those, 87% appear to migrate to Hawaii, 11% to Mexico, and 2% to both Hawaii and Mexico. Once again, we found no whales from the Central American breeding population.
We’ve been monitoring several oceanographic variables, including temperature, salinity, chlorophyll, and nutrient concentrations, at each survey station from June through September since 2020. The three plots show average chlorophyll within the top 20 meters for the first three months of the field season in 2023. Chlorophyll acts as a proxy for phytoplankton, which form the base of the ocean’s food web. In the Gulf of Alaska, the spring phytoplankton bloom – and therefore highest chlorophyll concentrations - typically occurs in late April through early May. We can see remnants of this in our June and July plots, where chlorophyll is highest, notably in North and South Chatham. The lower concentrations in August in most areas likely results from zooplankton grazing, which reduces the phytoplankton standing stock; however, these results are preliminary and will be compared to other oceanographic data for further insight.


Dana Bloch with a bottle of whale poop collected during whale abundance surveys. The AWF team was able to collect 8 samples this month, a much larger amount than usual. Photo by Jess McCoppin.

The field team eating dinner around the campfire looking at sunset over Frederick Sound. When the team is observing whales at stations further from Warm Springs, they often camp out to cut out travel time during whale abundance surveys. Photo by Jess McCoppin.

Field member Annie photographing a whale fluke during our monthly abundance survey. The whale's fluke will be used to identify the whale and find and/or create a profile in the database at happywhale.com. Photo by Jess McCoppin.
About AWF's Field Work:
Each month from June through September, the AWF team visits up to 108 survey stations that are evenly distributed throughout the study region. At each station, the team conducts a 15min 'point count' and records the location of every whale they observed. At the same time, they deploy probes that measure ocean salinity, temperature and chlorophyll concentrations - the latter a proxy for phytoplankton biomass - from the surface to a depth of ~50m. They also collect water samples to measure nutrient concentrations. These data provide a detailed picture of the water column’s physical and chemical structure throughout the study region.
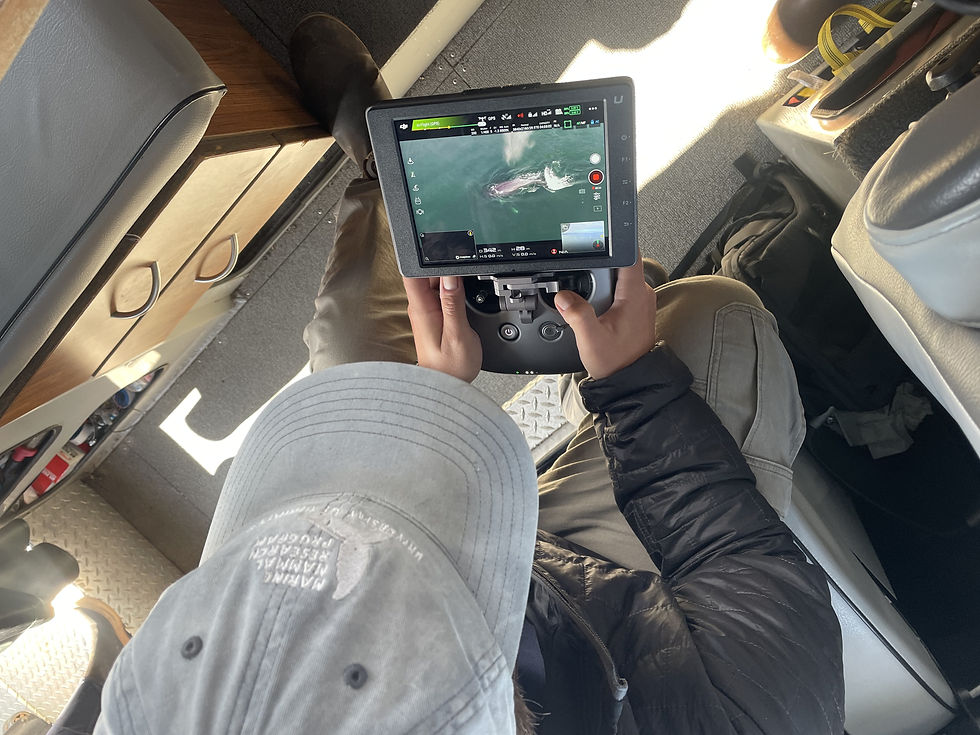
After completing the point count, the team then travels to each whale they observed to collect photo-identification images, launch Unoccupied Aerial Systems (“drones”) to measure the body volume of individual whales, and collect biopsy samples to measure hormone concentrations, stable isotope ratios (for reconstructing diet) and examine genetic profiles. Once all these data have been collected, the team travels to the next station and repeats the process. It takes a minimum of 9 days to complete each survey; however, it can take far longer if weather and whales are uncooperative.
About AWF's Research Reports
AWF aims to bridge the gap between scientists, stakeholders, and the public by communicating our general research findings through publicly available reports and information brochures. These reports provide up-to-date information on the status of Southeast Alaska humpback whales and are intended to serve as resources for local communities, stakeholders, policymakers, and educators.
Stay tuned for monthly reports during our field season from June-September, as well as an annual research report released every fall. You can also sign up for our newsletter below and visit this page to support AWF's research financially.


Really cool to see the Alaska Whale Foundation research shining a light on marine life and conservation! It reminds me how strong stories whether about protecting whales or iconic style connect us in unexpected ways. For example, the MobLand 2025 Tom Hardy Black Coat worn by Harry Da Souza brings cinematic energy and bold design into everyday fashion, showing how film and culture can influence what we choose to wear and how we express ourselves.
good evening I am bryan kirshon from new England i am a conservationist and biologist I subscribed to the newsletter i love our whales the largest organisms on earth with in California waters the blue whale the largest species to ever live on earth at 100 feet long and 200 tons. please keep me posted about whales on the newsletter. 🐋